Hi all,
Additional info and a screenshot of our Dashboard here at the University of Miami. Contact info at the bottom if anyone has any questions. – Patty
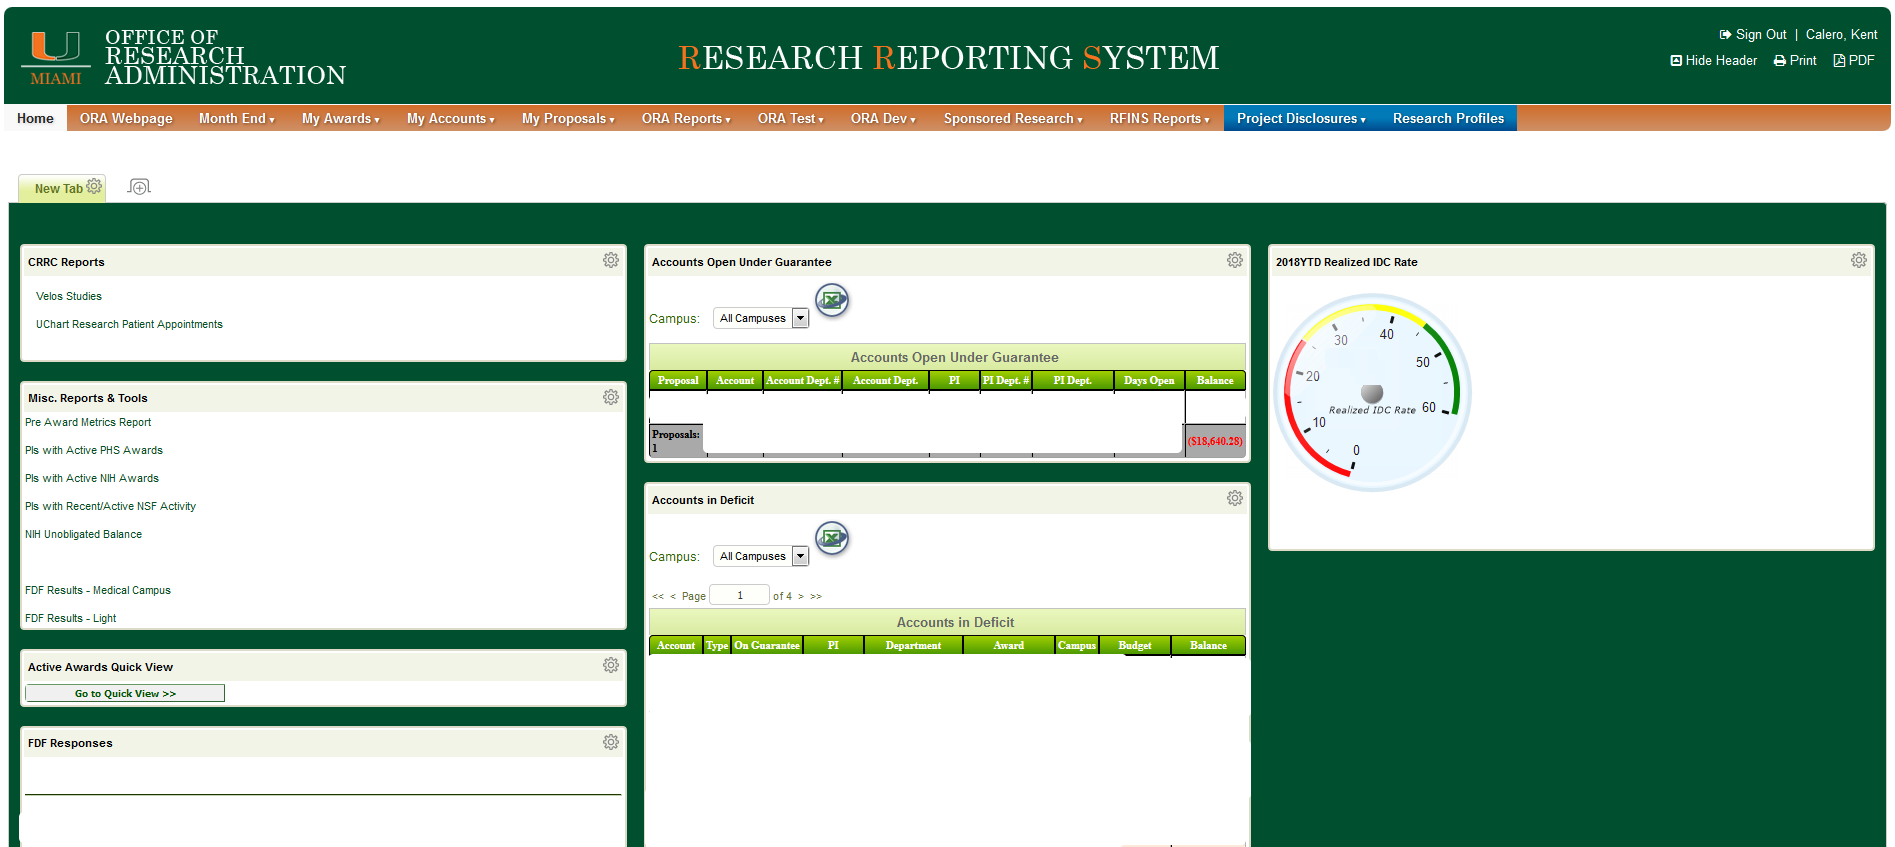
At the University of Miami, we used Logi Analytics to create a full featured research reporting system, including ad-hoc report delivery, canned reports, visualization, and dashboards. The system is used by PIs, departmental and organizational
administration, grant administrators, and central Research Administration. With Logi we were able to implement security at almost every level (proposal, award,account,PI) and we created a mostly hassle free reporting system. What’s great about Logi is that
you can do just about anything with the software, the bad is that sometimes simple things take a little longer to accomplish, than what you’d expect. Below is a screenshot of what our basic landing page looks like:
Cordially,
 Kent
L. Calero
Kent
L. Calero
Business Systems Analyst
Office of Research Administration
University of Miami
1320 South Dixie Highway, 650N | Coral Gables, Florida 33146
Office: 305-284-6072 |
xxxxxx@miami.edu
From: Research Administration List <xxxxxx@lists.healthresearch.org>
On Behalf Of Martha Taylor
Sent: Wednesday, April 4, 2018 9:48 AM
To: xxxxxx@lists.healthresearch.org
Subject: Re: [RESADM-L] Creating dashboards, charts, and reporting for sponsored projects?
Following on to this conversation. We are beginning the process of creating dashboards. Seems to be all the rage lately. However, the ones we will start with will be static until software is procured to allow
dynamic drilling down into the data that is represented by the dashboard. As we all do, I have been scouring university websites for examples of the types of data and the general look and feel of the various dashboards schools are using. HOWEVER, most are
internal to the institution and require login credentials to access. If possible and if willing, would those of you doing this well be willing to share some screen shots of your general look and feel of your dashboards with the rest of us? Imitation is the
best form of flattery??????
Thanks.
From: Research Administration List <xxxxxx@lists.healthresearch.org>
On Behalf Of Wolf, Baron
Sent: Friday, March 30, 2018 2:21 PM
To: xxxxxx@lists.healthresearch.org
Subject: Re: [RESADM-L] Creating dashboards, charts, and reporting for sponsored projects?
Hi Todd,
At the University of Kentucky we use Tableau and have created an online data portal for faculty, staff, and students to access this information. Tableau offers free trials if you would like to try it out. A very user friendly application
that doesn’t require coding or programming. While tableau would be able to directly connect with PeopleSoft, it is better to have the data go into a data warehouse if you have one. This helps with performance.
Attached is a graphic of what our table of contents currently looks like. We will be launching version two of the portal in the next couple of months.
Baron
![]()
![]() Baron
G. Wolf, MPA
Baron
G. Wolf, MPA
Assistant Vice President for Research
Strategy & Data Analytics, Chief of Staff
Office of the Vice President for Research
University of Kentucky
311 Main Building Lexington, KY 40506
859.257.3259 www.research.uky.edu
TRANSFORMING TOMORROW by
Utilizing Data to Drive Decisions
-----Original Message-----
From: Research Administration List <xxxxxx@lists.healthresearch.org> On Behalf Of Todd C. Travis
Sent: Thursday, March 29, 2018 11:17 AM
To: xxxxxx@lists.healthresearch.org
Subject: [RESADM-L] Creating dashboards, charts, and reporting for sponsored projects?
I wanted to ask the list what software or programs any schools may be using to create dashboards, charts, and/or reporting functions for the dissemination of sponsored research data? And specifically those schools that may use Peoplesoft
for the Pre- and Postaward functions. We are looking for ideas, options and ways to be able to present data to faculty and administration in a "live" and user-friendly way -
--
Thanks, Todd.
**************************************
Todd Travis
Sr. Research Administration Advisor/
Lead Preaward and Data Analyst
Sponsored Research Services
Clarkson University
118 Technology Advancement Center
8 Clarkson Avenue, CU Box 5630
Potsdam, NY 13699-5630
V: 315-268-4335
F: 315-268-6515
**************************************
= = = = = =
Instructions on how to use the RESADM-L Mailing List, including subscription information and a web-searchable archive, are available via our web site at
https://na01.safelinks.protection.outlook.com/?url=http%3A%2F%2Fwww.healthresearch.org&data=02%7C01%7Cbaron.wolf%40UKY.EDU%7C306b2bdbf19e4926aaa308d595885ba5%7C2b30530b69b64457b818481cb53d42ae%7C0%7C1%7C636579335254730685&sdata=XB3pgzcIvIEx7PPEFXCYScH4%2BIATZu4f5cEvW6AQJ1I%3D&reserved=0
(click on the "RESADM-L" link under "Sponsored Programs").
A link directly to helpful tips:
https://na01.safelinks.protection.outlook.com/?url=http%3A%2F%2Ftinyurl.com%2Fresadm-l-help&data=02%7C01%7Cbaron.wolf%40UKY.EDU%7C306b2bdbf19e4926aaa308d595885ba5%7C2b30530b69b64457b818481cb53d42ae%7C0%7C1%7C636579335254730685&sdata=ZC9AiOutUKVqV6jsG%2FtNT1m2dJx%2Bk7TiBu1NlD%2FvK4M%3D&reserved=0
= = = = = =
= = = = = =
Instructions on how to use the RESADM-L Mailing List, including subscription information and a web-searchable archive, are available via our web site at
http://www.healthresearch.org (click on the "RESADM-L" link under "Sponsored Programs").
A link directly to helpful tips:
http://tinyurl.com/resadm-l-help
= = = = = =
= = = = = =
Instructions on how to use the RESADM-L Mailing List, including subscription information and a web-searchable archive, are available via our web site at
http://www.healthresearch.org (click on the "RESADM-L" link under "Sponsored Programs").
A link directly to helpful tips:
http://tinyurl.com/resadm-l-help
= = = = = =